Tables
A table is an array of data organized in rows and columns, or, possibly, in a more complex structure. As a communication tool, a table helps to arrange and present some types of information in a way that otherwise might not be obvious or readily understood.
Tables fall into a similar category as pictures and diagrams. In contrast to running text, all these tools are for a more visual representation of data. A table should be designed so that its main points are easy to understand just by skimming through the table. The text referring to the table may summarize the main points of the table content but should not repeat the details.
As the design and implementation of tables usually take more time comparing to writing a textual description, start by planning a table structure that will allow you to present information as clearly and efficiently as possible. It will help to avoid spending time on multiple iterations later.
When to Use Tables
Use tables to present information that is easier to read if organized in rows and columns rather than in running text. There are several specific situations in which tables are routinely used in Espressif documentation as a matter of custom or formal convention:
Organize and present repetitive information so it is easier to search and look up specific values, e.g., register map of microcontroller’s peripherals grouped by the peripheral functionality.
Provide quick reference instructions or descriptions, e.g., for key components of a development board.
Provide a way to compare and analyze data applicable to specific conditions, e.g., power consumption of a device depending on communication throughput.
There are situations where presenting the data in an alternative way may be more effective or appropriate:
Consider using a graph to compare data if you are more concerned with relationship of the data than absolute values. But if you need to provide specific values that are difficult to read from a graph, then a table is a better option.
If a table would contain a single column, use a list instead.
If a table would contain two or fewer columns and rows, consider presenting information in a numbered or bulleted list or in text format.
For extensive tables that take one or more pages to present, consider additional alternatives:
Splitting large and complex tables into smaller individual tables
This alternative may be useful if the table contains several records grouped into a smaller number of categories, and you describe the table contents category by category. Consider separating that description into individual tables instead of providing a single large table at the end.
Putting extended tables in an appendix
If the table contains supplementary information that is not essential for understanding of presented ideas, it should be placed at the end of a document.
Changing the page layout to landscape to accommodate wide tables
This is a good alternative to reducing the font size if the table does not fit into the page width.
Elements of a Table
Sample Table 1. Digital Signature Memory Blocks illustrates a simple example of a table with six columns and three rows. The first row is not counted, because it is only used to display the column names. It is called a header row. Some columns of a similar category may be grouped and placed under another head above called a spanner head, such as “Memory Address” in the table below. The heads below the spanner head, as well as all the other heads in the header row, are called column heads.
Always add a header row to a table, so it is clear what data is presented in each column.
Name |
Description |
Size (byte) |
Memory Address |
Access |
|
|---|---|---|---|---|---|
Start |
end |
||||
DS_C_MEM |
Memory block C |
1584 |
0x0000 |
0x062F |
WO |
DS_X_MEM |
Memory block X |
512 |
0x0800 |
0x09FF |
WO |
DS_Z_MEM |
Memory block Z |
512 |
0x0A00 |
0x0BFF |
RO |
The left-hand column of a table is called a stub (see the column “Name” in the table above). It usually provides a vertical listing of data categories in the columns to the right. Add a stub if rows show similar records of data, e.g., measurement results, and there is no other way to clearly identify specific record, e.g., to specify the time when the measurement was taken. In this case, the stub may be in the form of an index column providing a consecutive number of each measurement.
The stub head may be omitted if the entries below are too unlike or self-explanatory, for example “Symbol” may be omitted in Sample Table 7. Recommended Operating Conditions.
The stub and the related columns on the left may be formatted differently, if the data is grouped and categorized by rows. As an example, see Storage Locations for Image Files.
Columns originating from row headings and rows originating from stub entries intersect and create cells.
A column should preferably contain the same kinds of information, for instance, a memory start address appears in one column, end address in another, and information expressed in words like memory access type in yet another column. No column should contain identical information in all its cells, place such information in table notes or table description instead. See below an example of a table with redundant information in column “Connection”.
Ordering Code |
Core |
Embedded Flash |
Connection |
Package |
|---|---|---|---|---|
ESP32-D0WDQ6 |
Dual core |
No embedded flash |
Wi-Fi b/g/n + Bluetooth® + Bluetooth LE |
QFN 6*6 |
ESP32-D0WD |
Dual core |
No embedded flash |
Wi-Fi b/g/n + Bluetooth® + Bluetooth LE |
QFN 5*5 |
ESP32-D2WD |
Dual core |
16-Mbit embedded flash (40 MHz) |
Wi-Fi b/g/n + Bluetooth® + Bluetooth LE |
QFN 5*5 |
ESP32-S0WD |
Single core |
No embedded flash |
Wi-Fi b/g/n + Bluetooth® + Bluetooth LE |
QFN 5*5 |
In the following table redundant information has been placed in a note below.
Ordering Code 1 |
Core |
Embedded Flash |
Package |
|---|---|---|---|
ESP32-D0WDQ6 |
Dual core |
No embedded flash |
QFN 6*6 |
ESP32-D0WD |
Dual core |
No embedded flash |
QFN 5*5 |
ESP32-D2WD |
Dual core |
16-Mbit embedded flash (40 MHz) |
QFN 5*5 |
ESP32-S0WD |
Single core |
No embedded flash |
QFN 5*5 |
- 1
All above chips support Wi-Fi b/g/n + Bluetooth® + Bluetooth LE connection.
In some situations, the last row and the last column may be used to provide a total number or summary of data. Such rows and columns should be made distinguishable by applying different formatting.
Organizing Information in a Table
The information presented in a table should be easy to scan from left to right and from top to bottom. The following good practices can help to organize information more efficiently:
Make table heads descriptive but concise.
Group columns containing similar data into categories. Provide description for categories in spanner heads (merged cells). If you then further group categories, for ease of reading, make sure that your spanner head hierarchy does not exceed two levels.
Group rows containing similar data into categories. Put the category description in a merged cell and provide data in rows in the columns to the right.
Depending on data presented, indicate the measurement units or add some other clarification about the data in the column. Place this information below the column head in parentheses. For example, in Sample Table 1. Digital Signature Memory Blocks, it is recommended to put the measurement unit “(byte)” below “Size” if the table is not in Markdown or reStructureText.
For narrow columns, where the data fits the column width but there is not enough space for description in the header, or the provided description is not informative enough, add references to notes below the table.
When using an abbreviation to fit information in a table cell, make sure its meaning is clear. Provide clarification in the table notes if required. Use the same abbreviation in the descriptive text when referring to the cell contents.
If you need to add notes to table entries, mark the entries using consecutive numbers, letters, or other symbols like an asterisk (*) in superscript. Use numbers if most or the marked entries are words and use letters if most of the marked entries are numbers, etc. The reason is that a number or letter in superscript might be mistaken for an exponent. Place the notes immediately below the table following the text “Notes”, see Sample Table 7. Recommended Operating Conditions. Each note should begin with the character (number, letter or symbol) used to mark a respective table entry.
Follow consistently all selected conventions for organizing data in a table throughout your document, especially when presenting a similar type of data or concept.
Table Style
The table style describes attributes like line thickness, header row shading, alignment of table’s contents in columns, font size, etc. Use already established style provided in a template for a selected document type. The style may depend on a presented data type. Use the selected style consistently within a table and for tables throughout your document. Readers may get confused seeing non-consistent style, and it may take them longer to read and understand the data. The readers are also likely to misinterpret the same category of data, if it is presented in a different style.
For documents written in markup languages such as reStructuredText and Markdown, simply follow the established table style.
General Recommendations for Style
Below are a couple of recommendations for the table style. Use them if the recommendations are not already covered in a specific template:
Make the header row distinct by using bold text or shaded background and headline-style capitalization.
The default horizontal alignment in table cells is to the left for text and to the right for numbers, except for cases noted in Sections Alignment of Text in Cells and Alignment of Numbers in Cells.
In table cells, do not capitalize single-word entries for non-header cells, and capitalize sentence-length entries. Follow punctuation rules described in Section Punctuation in Lists.
If a table contains a few rows, keep the table on a single page. In particular, depending on the software used, do not configure it to break across pages.
Omit redundant information if it makes easier to analyze the data inside a table. For example, see Sample Table 4. Peripheral Clock Usage—here only the clocks actually used by a specific peripheral are marked as “Y”. Putting “N” in the rest of the cells will make it harder to look up which peripheral uses which clock.
Peripheral |
APB_CLK |
REF_TICK |
LEDC_SCLK |
|---|---|---|---|
TIMG |
Y |
Y |
|
I2S |
Y |
||
UHCI |
Y |
||
UART |
Y |
Y |
|
RMT |
Y |
Y |
Y |
LED |
Y |
Y |
Use em dash (—) for not applicable data, see Sample Table 7. Recommended Operating Conditions. It is fine to omit em dash, if the table contains the same kind of data, see Sample Table 4. Peripheral Clock Usage for example.
Avoid stretching the table to the page width and making the columns wider than required by the header and the data inside. On the other hand, if columns contain similar type of data, preferably make them of the same width, see Sample Table 4. Peripheral Clock Usage as an example.
Center-align tables on a page (see below).
Timer Group |
Bus to Access Peripheral |
Base Address |
|---|---|---|
TIMG0 |
PeriBUS1 |
0x3F41F000 |
PeriBUS2 |
0x6001F000 |
|
TIMG1 |
PeriBUS1 |
0x3F420000 |
PeriBUS2 |
0x60020000 |
For tables with long rows and multiple columns containing a lot of data, consider using banded rows or columns (alternate shading) to avoid misplacing data and to improve readability.
Alignment
Alignment of Column Heads
Please use the following recommendations. For illustration, see Sample Table 6. Wi-Fi Reason Code.
The stub heads (first column) should be left-aligned.
The column heads (first row) should be left-aligned or centered following the alignment of the column’s cells (see the sections below).
If a column is right-aligned, that is normally the case for numbers, then the head should be center-aligned.
Alignment of Text in Cells
Please use the following recommendations, that apply primarily to horizontal text alignment. See Sample Table 6. Wi-Fi Reason Code for examples.
Paragraphs of text should be aligned left like running text.
Single words should normally be centered, except for stubs.
Apply center alignment vertically.
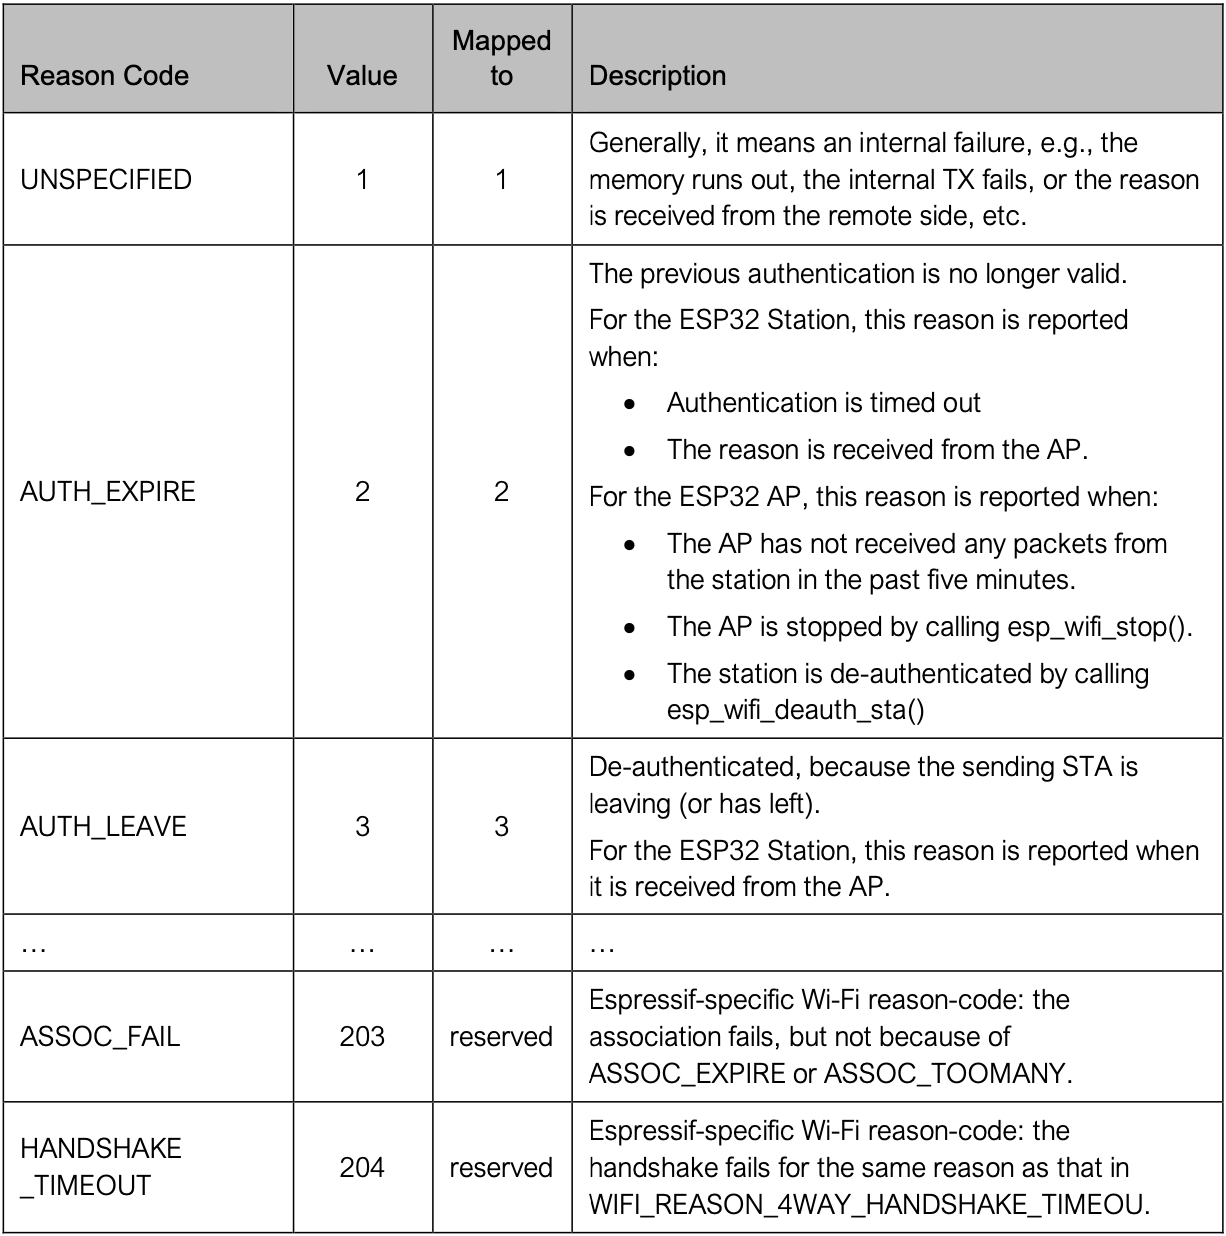
Sample Table 6. Wi-Fi Reason Code
Alignment of Numbers in Cells
Proper alignment of numbers simplifies their comparison and analysis. Values can be aligned to the last significant digit, to the decimal point, or by using the same units and a fixed number of digits.
Here are specific recommendations:
Integers are usually aligned to the least significant digit.
Numbers that include decimal points are usually aligned to the decimal point. If your application does not support explicit alignment on decimal point, you can usually align the values the right (number of decimal places is usually the same for the same type of data in a column).
Column that includes different types of numbers should preferably be aligned according to the most frequently occurring type, see Sample Table 7. Recommended Operating Conditions.
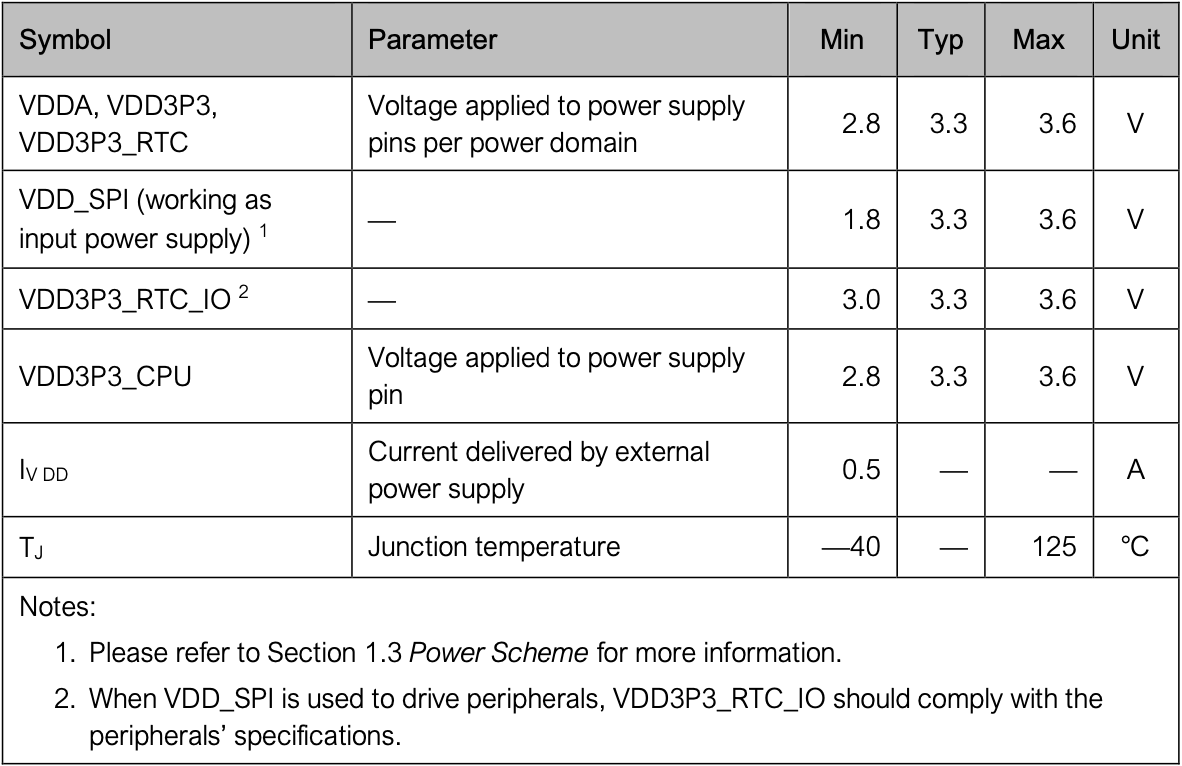
Sample Table 7. Recommended Operating Conditions
Present numbers of the same category preferably in the same measurement units for better readability. If this is not possible, indicate their respective units, e.g., MHz, Mbps, mA – see Sample Table 7. Recommended Operating Conditions and Sample Table 8. Current Consumption Depending on RF Modes.
Number of presented significant digits should be adequate to the range and context of presented values. For example, show 68 mA instead of 68.512 mA when providing the average RF power consumption in RX 802.11n, 40 MHz working mode, see Sample Table 8. Current Consumption Depending on RF Modes.
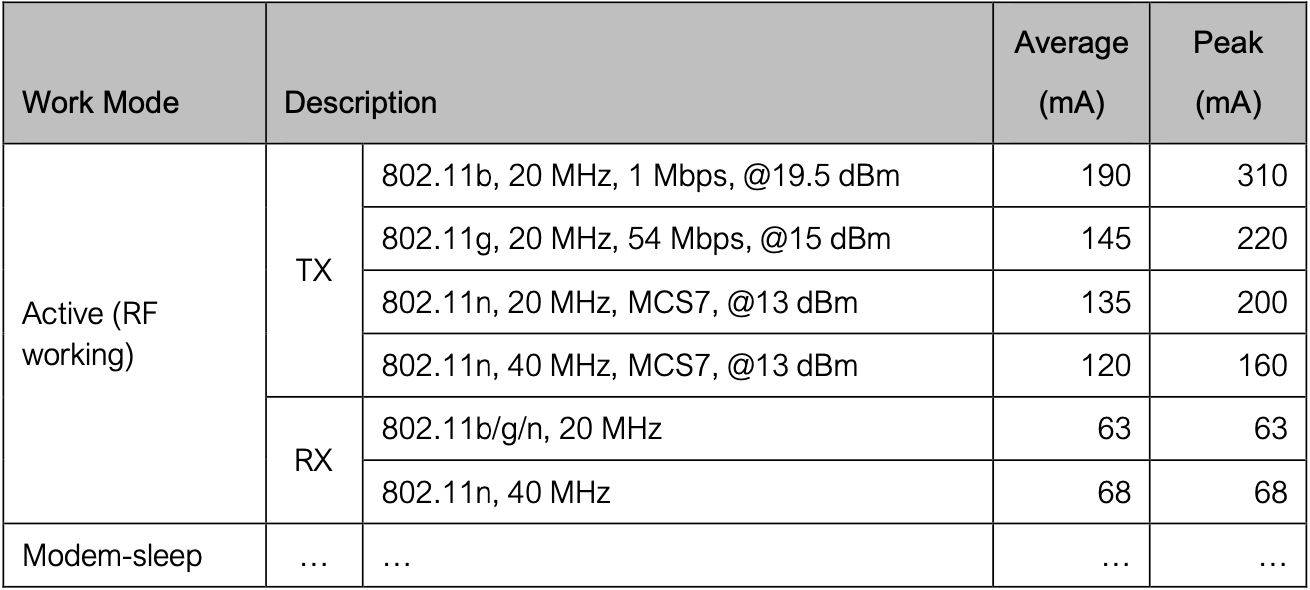
Sample Table 8. Current Consumption Depending on RF Modes
Uncontrollable Alignment
If your application does not support the recommended alignment above, follow the default alignment while keeping the table format as consistent as the recommended style as possible.
Placement in a Document
As tables fall into a similar category as pictures and diagrams, similar rules apply to numbering, captions, positioning in text, and cross-referencing. For details please see Chapter Pictures and Diagrams > Section Placement in a Document.
There is a couple of additional guidelines that apply to the tables:
Use the keyword Table instead of Figure in captions.
Refer to every table from the text.
If a table contains some data for reader’s analysis, the caption should not suggest any interpretation of the data.